Due date: 2021 June 18 at 17:00 (Melbourne time)
Given the late submission time in the semester, and the requirement for me to submit your final grades to the University, there will be no extensions on the assignment deadline.
Revised due date: 2021 June 22 at 17:00 (Melbourne time)
The assignment includes four questions. Question 1 is mandatory. You may select two questions from Questions 2, 3, and 4, that you would like to submit for the assignment. At the top of your assignment you must state which questions you have chosen to answer. You may submit answers to all four questions, if you wish, but the fourth question will be marked as a 'bonus question'. If you wish to submit answers to all four questions, then you must specify which is the bonus question. Do not submit something 'half-done' for a bonus question, or you will receive zero marks for it: if you submit an answer to a bonus question then it must be a complete submission.
Your submission must be in the form of a PDF, preferrably compiled from \(\LaTeX\), that includes relevant figures. Accompanying code used to generate figures and results in the PDF must be provided.
Important:
The problem sets gave more explicit instructions and steps for different data analysis tasks. Here you will not get explicit steps, but you will be marked on how detailed you present your response to the question. Remember to specify models, priors, marginalisations, network architecture, and appropriate metrics.
Marks will depend on the results/figures that you produce, and the clarity and depth of your accompanying interpretation. Don't just submit figures and code! You must demonstrate understanding and justification of what you have submitted. Please ensure figures have appropriate axes, that you have adopted sensible mathematical nomenclature, et cetera.
Question 1: Hierarchical models
Read this question carefully as it differs from the lecture material.
A company has found that the widgets they manufacture contain some mysterious radioactive material. The company produced 100 widgets in 35 days before they realised the widgets contained radioactive material. Then it took 14 days before an investigation was started. The investigation took 90 days. During the investigation, a company worker would visit the location where a widget was shipped to, and measured the radioactive material in the widget. Only one measurement of the radioactive material was performed per widget.
In this file you will find the time of measurement, and the amount of radioactive material measured by the investigator, and some uncertainty in that measurement. This is what the data look like:
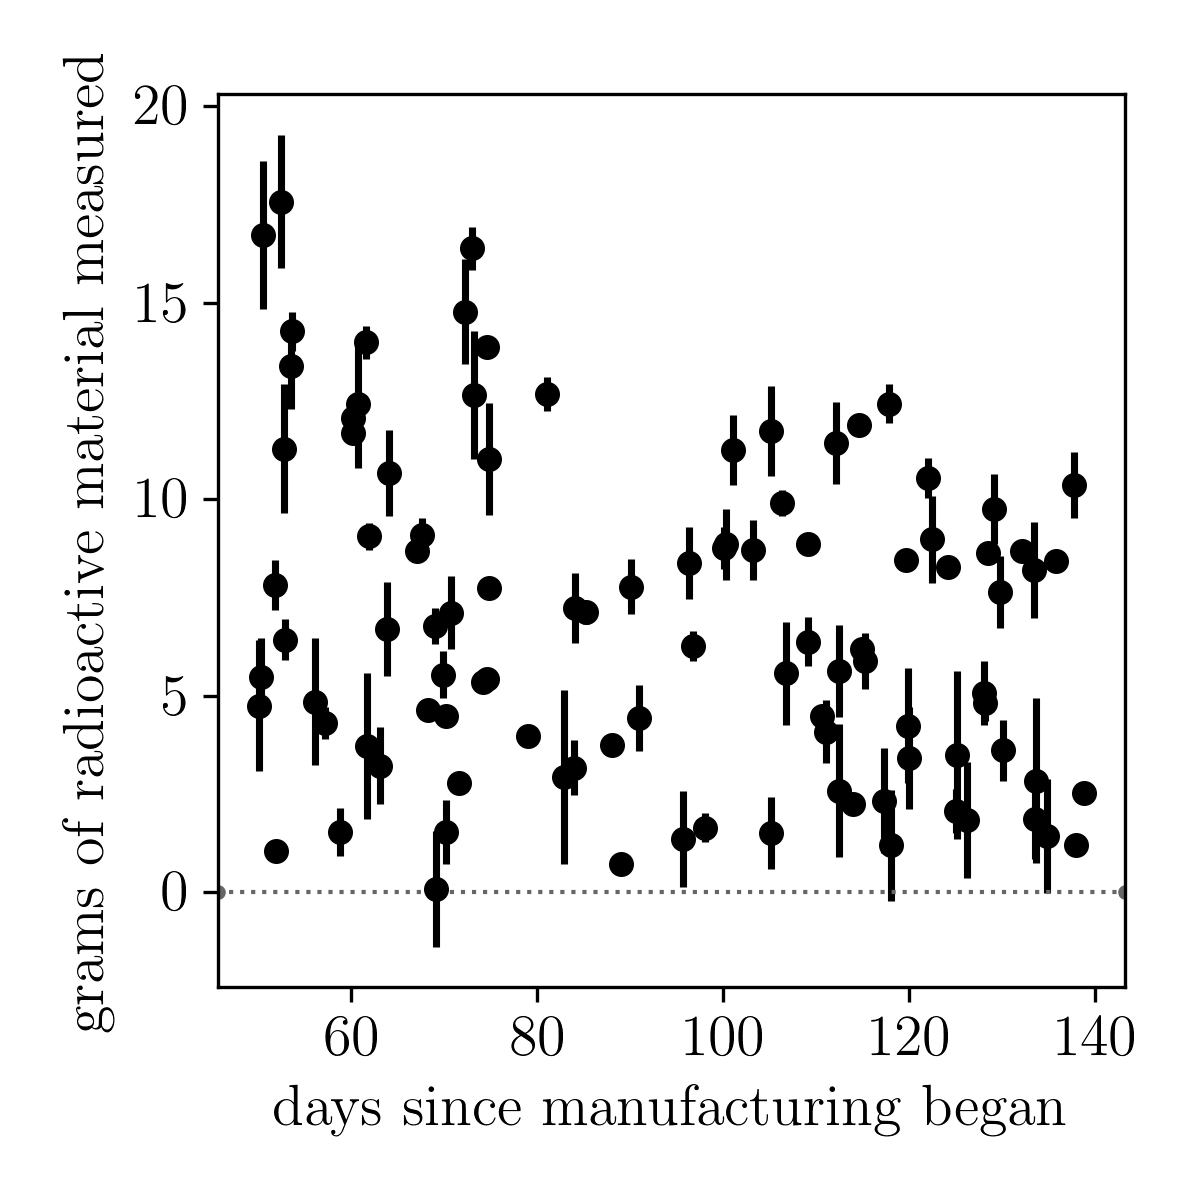
The company has asked you whether you can infer the rate of radioactive decay of the material in the widgets. They know that the amount of radioactive material \(N\) at any time \(t\) is \[ N = N_0\exp\left(-\alpha\left[t-t_0\right]\right) \] where \(N\) is measured in grams and \(t\) is measured in seconds. They also know that the detectors they use to measure the amount of radioactive material reports uncertainties that are normally distributed.
The company does not know how much radioactive material was initially put into each widget, but they know that the amount is different for each widget. However, they do know that the initial amount of radioactive material must be less than 20 grams in every widget.
Unfortunately, the company also does not know when each widget was made. All they can tell you is that all 100 widgets were made in 35 days. You can see how this careless operation has led to such a problematic situation!
Your first task
Infer the decay rate \(\alpha\) for the mysterious radioactive material.
Your second task
The company is delighted with your work. However, there is a problem. The investigation team used three different detectors to measure the amount of radioactive material in each widget. Each detector costs $1,000,000, and they are suspicious that one of those detectors is giving biased measurements. They need you to infer which detector is giving biased measurements, and to infer what the level of that bias is. After accounting for the biases, have your inferences on \(\alpha\) changed?
Question 2: Gaussian processes
Download this dataset which includes the brightness of a star as a function of time. From these data you will see that there is a quasi-periodic signal in the data, which is due to stellar rotation. To read in the data:
Your first task
When data are complete (no missing data) and are evenly sampled in time, a Fourier transform can trivially identify periodicity in a signal. When data are missing, or unevenly sampled, you should use a Lomb-Scargle periodogram. Use a Lomb-Scargle periodogram to find periodicity in the data.
Your second task
Use a Gaussian process to fit these data (or some justified subset thereof) and make predictions for the future brightness of this star for two months after the last data point. Remember to specify the kernel choice, and all other relevant bits of information.
Question 3: Autoencoders
The following files contain images of hand-written digits:
Your first task
You will recall that an autoencoder is a neural network with a specific structure. Your task is to train an autoencoder using these images. Specify the network architecture in as much detail as you would explain a generative model.
Demonstrate that the latent space of your autoencoder smoothly represents digits by inputting the test-set images and recording the latent space values found for each image. Plot the latent space values coloured by the known test set labels.
Your second task
Is to use the autoencoder to generate new images of digits that have not been drawn by a human! Create a grid of latent space values. At each grid point, use the decoder to make a prediction of an image. Show that image on a grid point. Repeat this process until you have smoothly mapped out (two dimensions of) the latent space.
Question 4: Classifying galaxies
The dataset (download here; 200 MB) contains 25,753 coloured images (g, r, and i band) each 69 x 69 pixels in size. There are 10 classes of galaxies:
You will need h5py to load these data:
Your task
Train five classifiers (different techniques) to classify galaxies. You can choose these techniques, but you should choose them to be appropriate for the problem and suitable to give good results on this data set. Ensure that you split your data set appropriately to train, validation (where appropriate), and test.
Evaluate these classification techniques and make a recommendation for which is most suitable. As part of evaluating performance, you should consider and discuss things like precision, recall, confusion matrices, biased/unbiased training sets, and cross-validation.